Note:
|
Definitions
Some common terms associated with these reports are defined below.
|
Term
|
Definition
|
|
Opening Cash Amount
|
Amount of cash available at shift start.
|
|
Closing Cash Amount
|
Amount of cash in the drawer at the end of shift as entered by the employee at shift end.
|
|
Net Cash in Drawer
|
Sum of all positive/negative cash transactions and the amount that should be present in the cash drawer.
|
|
Cash Difference
|
The difference between the net cash calculated and the reported actual amount.
|
Access the reports
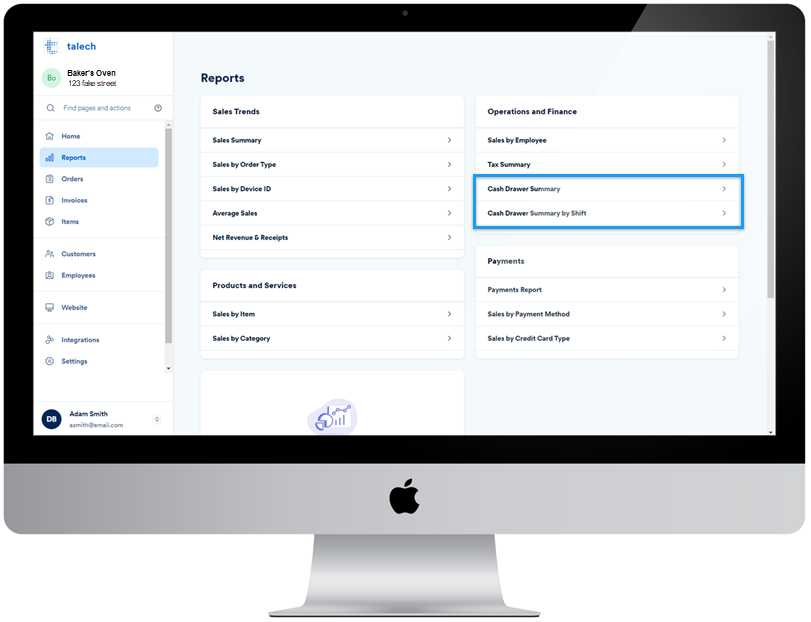
- You can access the reports from talech.com > Reports.
- On the right side of the screen, under Operations and Finance, you’ll find the two cash drawer reports.
Back to top
Cash Drawer Summary report
As a merchant you need to know how much money is in your cash drawer at any given time so that you can add cash where needed and determine the types of transactions that are driving significant changes. This is where the Cash Drawer Summary report can help.
Cash Drawer Summary: Overall view of opening, closing, and actual balances across cash drawers over time as well as the discrepancies between expected and actual balances.
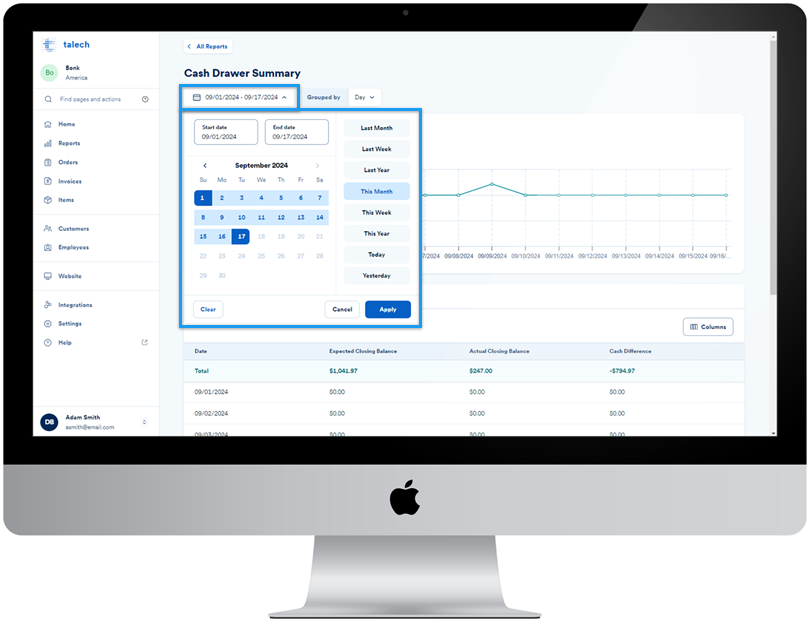
Sales trends chart
At the top is a line chart displaying data based on the date, Metric, and Grouped by fields. The chart displays both the positive and negative deviations from zero as transactions add or subtract from the net cash in the drawer.
There are defaults selected when first navigating to this report, but you can change any of these fields to view a different data set.
For the date, you have a choice of several time ranges. Select the date dropdown to view your options.
For the Metric, you have a choice of different sales trends related to cash drawer specific activities.
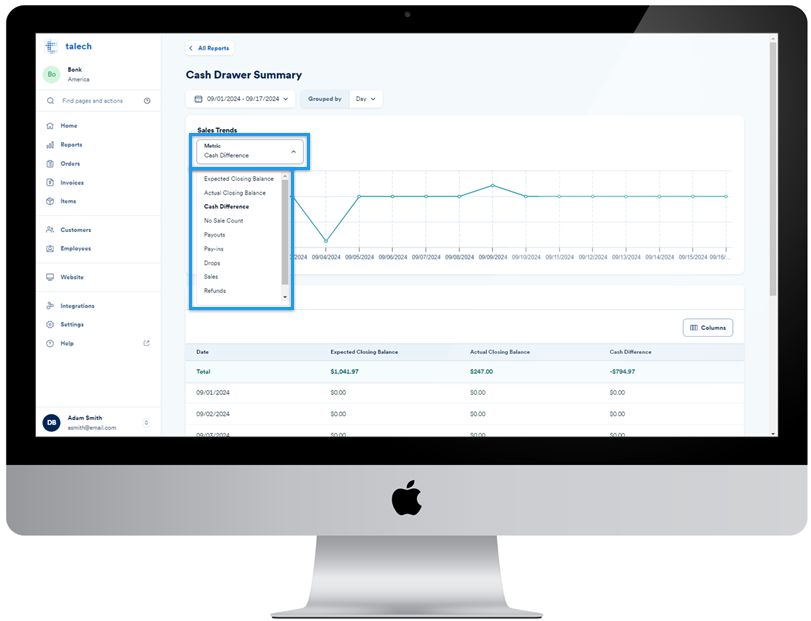
For the Grouped by, you have a choice of Day or Month, which changes how the metric’s data points will be grouped. In general, the day will be more useful unless you are looking at yearly data and want to see the breakdown month over month through the year.
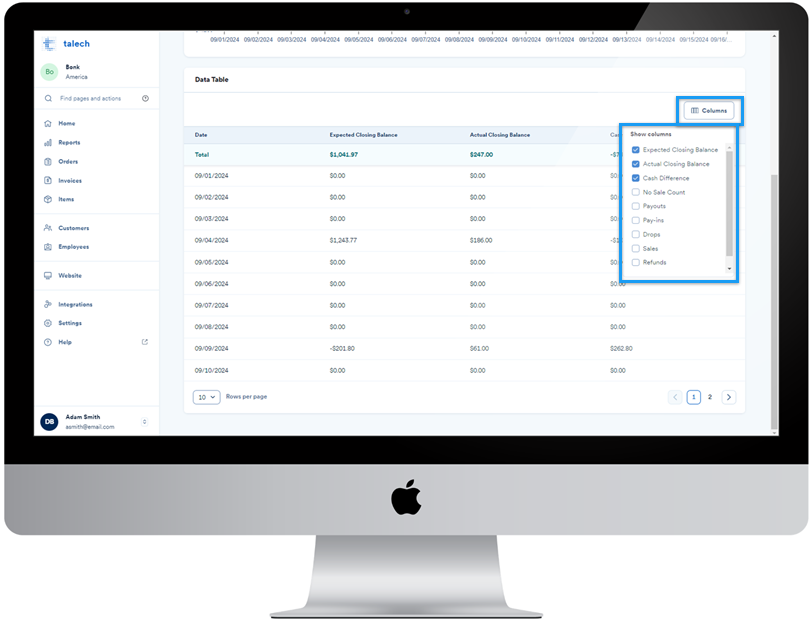
Data table
Below the chart is a data table showing your Expected Closing Balance, Actual Closing Balance, and Cash Difference for the date range selected.
If you’d like to include additional columns in this table, select Columns and check the columns to bring them into the table view.
Back to top
Cash Drawer Summary by Shift report
As a merchant if you are seeing significant changes or anomalies in cash drawer balances, you need a way to identify those anomalies and explore the kind of activity that is causing them and who’s doing it. This is where the Cash Drawer Summary by Shift report can help.
Cash Drawer Summary by Shift: Filter by specific shifts and employees so that issues or discrepancies can be identified.
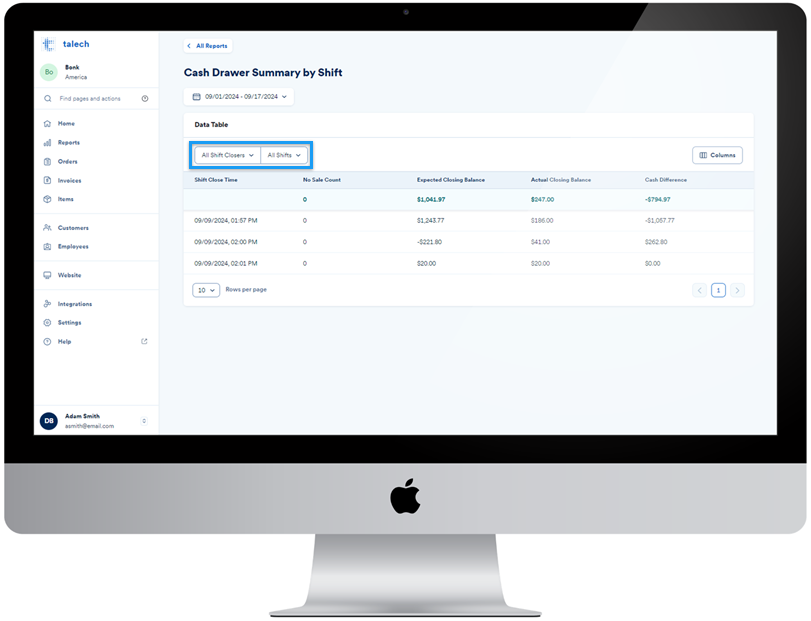
Data Table
The data table for this report shows you the sale count, Expected Closing Balance, Actual Closing Balance, and Cash Difference broken down by shift (remember only closed shifts will be shown).
By default, the report shows you all shift closers and all shifts, but you can select a specific closer or shift from the two dropdown menus near the top.
- Shift Closers: Select from all employees associated with a closed shift in the date range selected.
- Shifts: Select from “balanced” or “unbalanced” shifts. An unbalanced shift is one in which the closing amount does not match the expected.
Back to top
Need more help?
- talech training & device support: 1-888-995-1998
- Paytura merchant support: 1-855-4-PAYTURA or contact Paytura